ComboCurve: Generate a Roll-Up in Scenario
Generate a Roll-Up in Scenario
Overview
Generating a Rollup in the Scenarios module is a quick way to aggregate time series data for a set of selected wells. The following graphs can be generated for forecast-only, production-only, and stitched (production and forecast combined): Gross Well Head Volumes, Gross Sales, WI Sales, Net Sales, and any Custom Company Stream.
Note: Selections in the scenario for "Actual or Forecast" govern whether historical production is available in the Roll-Up. Specifically, selecting "Ignore Hist Prod" = "Yes" will make historical production volumes unavailable in the Roll-Up.
Roll-Up Generation
Start by selecting/filtering the wells the user would like to aggregate time series data for. Once the user has selected the wells, navigate to the Roll Up option and click Generate Roll-up.
The Roll-Up setting menu will now prompt the following inputs:
- Date Range - set specific date range as well as can set to ignore forecast prior to a date.
Note: by default, the date range will be the entire length of the provided data, and for the stitched forecast data, it will start being used once production data is no longer available. - Start & End Dates can be entered to limit the resulting historical plus forecasted volumes. 50 total years of date range may be used so choose a range representative of what will be needed for analysis.
- Ignore Forecast Prior To Date is a specific truncation of the forecast aggregation so that it only begins after that date. This works in concert with the "Actual or Forecast" selection in the scenario.
- Stream type - Only Forecast, Only Production, Stitch (both). You also have the option to check all three stream types which allows you to be able to switch between on the chart.
- Stitch will output all historical and forecasts as a single unified stream governed by the "Actual or Forecast" selection in the scenario.
- Only Forecast and Only Production - Generate curves of one or the both of these.
- Resolution - Resolution is used to dictate which production streams can appear in the results for both historical production and forecasts. When exceeded, validation will help guide the selection as well as notification at the bottom of the dialog will appear. Note: This is dependent on the forecast configuration.
- Monthly - Limited to 50-years from the Date Range above.
- Daily - Further limited to only 20-years due to size/generation time constraints. When selected, even the Monthly data resolution is limited in order to align the two.
Additionally you have an option to add headers to be aggregated by. Volumes will be accumulated in tranches of the groupings of headers selected here.
View Roll-Up Charts
After generating the charts, select the Roll-Up charts option in the Roll-Up dropdown menu.
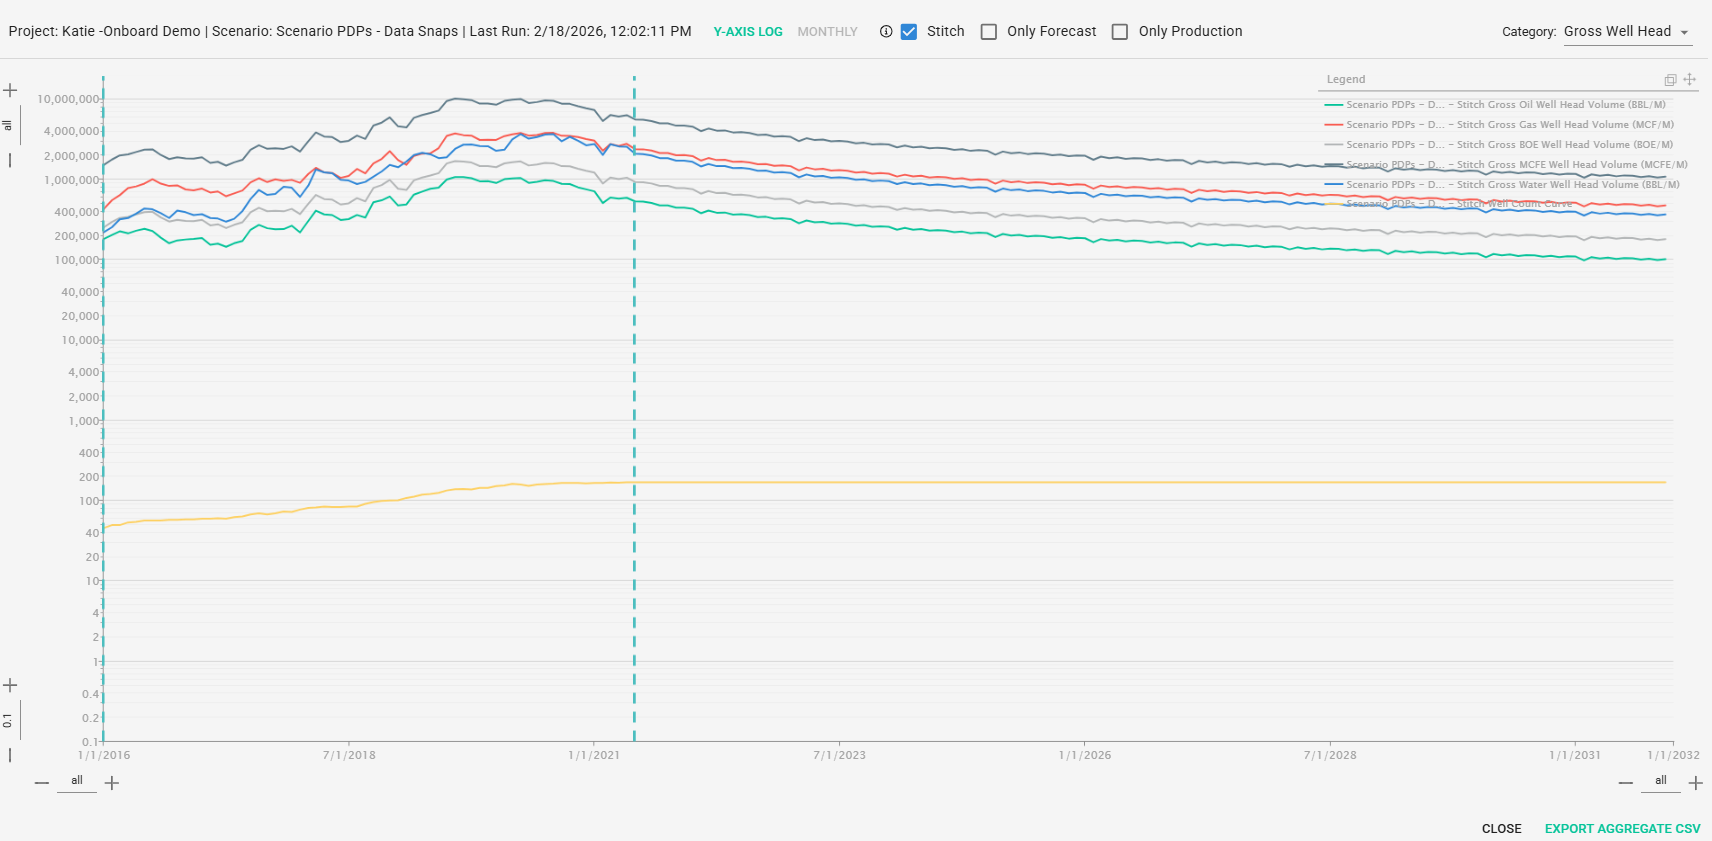
In the Chart View using the top menu the user can change the Y-Axis scale from Linear to Log and flip between monthly or daily data resolution being used. You can flip between or select multiple stream types by using the selecting the stream boxes. Note: the streams will only be available to select if they were initially selected when generating the roll up. The category drop-down menu can be used to adjust the stream type being shown on the graph.
Layout Options
- Y-AXIS - select LOG or LINEAR (Cartesian)
- +/- controls may be used to manipulate further the X and Y axes from both the minimum and maximum for each.
- MONTHLY/DAILY - select data resolution displayed or to be downloaded.
- Data Streams - Checkboxes enabled when selected on generate screen and make the available upon CSV export. Selection s on "Actual or Forecast" tab determine availability of "production" data.
- Stitch will display all historical and forecasts as a single unified stream governed by the "Actual or Forecast" selection in the scenario.
- Only Forecast and Only Production - Display curves of one or the both of these.
- Category - Production streams can be viewed any of the
- Gross Well Head - 8/8ths total volumes before any shrink/loss.
- Gross Sales - 8/8ths volumes after shrink/loss.
- WI Sales - Each input property's volumes times working interest, aggregated together. "Net to the WI"
- Net Sales - Each input property's volumes times revenue interest, aggregated together. "Net to the RI"
- Legend - Shows the currently active volumes displayed. This is interactive with MONTHLY/DAILY toggles as well as Stitch/Only Forecast/Only Production toggles. Additionally, the legend is interactive and any/all streams may be turned off by clicking on each legend item one at a time. The legend may be hidden or moved with the controls at the top-right.
- EXPORT AGGREGATE CSV - generates a csv export of the currently active selections (all categories from Gross Well Head to Net Sales).
- Note that the csv will ALWAYS be stitch if Stitch or BOTH Only Forecast/Only Production are selected. If production and forecast volumes are independently needed on output, make a separate export with one and then the other selected.
Export
Lastly, all of this aggregated data can be exported by the Export Aggregated CSV at the bottom right:
The vertical blue dotted lines represent the Production Start Date and the Production End Date in the chart.
Related Articles
ComboCurve: Scenario Tooltip Overview Article
Scenario Tooltip Overview Article Scenario Page (Overview of Main Screen) Top Left Hamburger Icon - to navigate to all CC sections Green Scenario Name - Quick navigation to the project landing page Top Right Guy Icon - Change name, password or log ...ComboCurve: Scenario Module Overview
Scenario Module Overview This document covers the overview and layout of the main screen. Layout Top Left Hamburger Icon - to navigate to all CC sections Green Project/Scenario Name - Quick navigation to the project landing page Top Right Guy Icon - ...ComboCurve: Production Taxes
ComboCurve: Production Taxes See the Scenario Tooltip Overview Article for all assumptions and modeling concepts In this article we will discuss the Production Taxes model in ComboCurve. Row Structure For production taxes modelling, we provide both ...ComboCurve: Forecast Rollup, Rollup Comparisons, & Aggregate Rollups
Forecast Rollups In this article, we'll be looking at rollups, aggregate rollups, and comparing rollups in the Forecasting module. ComboCurve allows users to create aggregate gross volume profiles, otherwise known as rollups, based off of your ...ComboCurve: Scenario Templates
Scenario Templates Overview Scenario templates let you save a reusable set of qualifiers and econ model assignments so you can build new scenarios or update existing ones in a single click, instead of recreating qualifiers and model assignments by ...