ComboCurve: Ratio vs. Cum Forecasting Overview
Ratio vs. Cum Forecasting Overview
Purpose
Ratio vs Cum Forecasting is a production forecasting technique that models how the water cut or gas-oil ratio of a well evolves as cumulative production increases. Rather than forecasting each phase independently, this approach captures the natural relationship between fluid ratios and cumulative volumes.
In ComboCurve, Ratio vs Cum Forecasting is built with the traditional Decline Curve Analysis (DCA) workflow. You begin by forecasting a primary phase (Total Fluid or Oil) on a rate-time basis using DCA, then layer in the ratio-based models for water and gas.
Note: Total Fluid = Oil + Water
In ComboCurve, Ratio vs Cum Forecasting is built with the traditional Decline Curve Analysis (DCA) workflow. You begin by forecasting a primary phase (Total Fluid or Oil) on a rate-time basis using DCA, then layer in the ratio-based models for water and gas.
Note: Total Fluid = Oil + Water
Use Cases
- Waterflood Modeling - In waterflooded reservoirs, injected water sweeps oil toward producing wells. As injection continues, water breakthrough occurs and water cut rises steadily. Ratio vs Cum forecasting captures this trajectory.
- Conventional Wells - Conventional vertical wells producing under primary depletion often experience gradual water encroachment from a bottom water zone or edge aquifer. As fluids are withdrawn, water cut rises in a predictable, log-linear trend tied to cumulative production rather than time
- Mature Field Production Forecasting - Fields in late-stage production often exhibit high and rising water cuts (90%+). Traditional rate-time DCA can struggle to capture this behavior, while Ratio vs. Cum models extrapolate the water cut trend directly from cumulative production history, producing more reliable forecasts.
- Gas-Oil Ratio Forecasting - The same Ratio vs. Cum framework applied to gas. GOR vs. Oil Cum or Total Fluid Cum models are well suited for: solution gas drive reservoirs where GOR rises as reservoir pressure declines and gas cap reservoirs experiencing gas coning.
Workflow
The workflow is organized into three steps: declining the primary phase, modeling water as a ratio, and optionally modeling gas as a ratio.
Note: Primary stream (oil or total fluid) must exist first to reduce volumes
Recommended steps -
Step 1 - DCA (Primary Phase)
Begin by navigating to the forecast module and selecting Traditional DCA. You will first model your primary production phase on a rate-time basis. You have two options for the primary phase:
Begin by navigating to the forecast module and selecting Traditional DCA. You will first model your primary production phase on a rate-time basis. You have two options for the primary phase:
- Total Fluid (Oil + Water combined)
- Oil (Oil Rate)
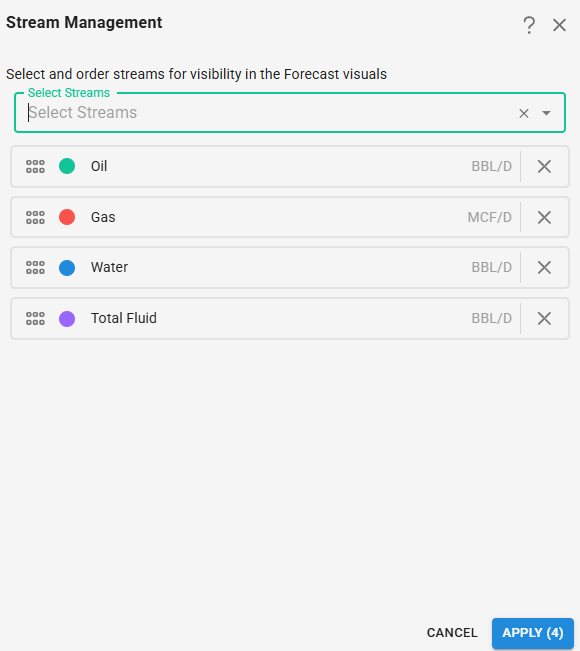
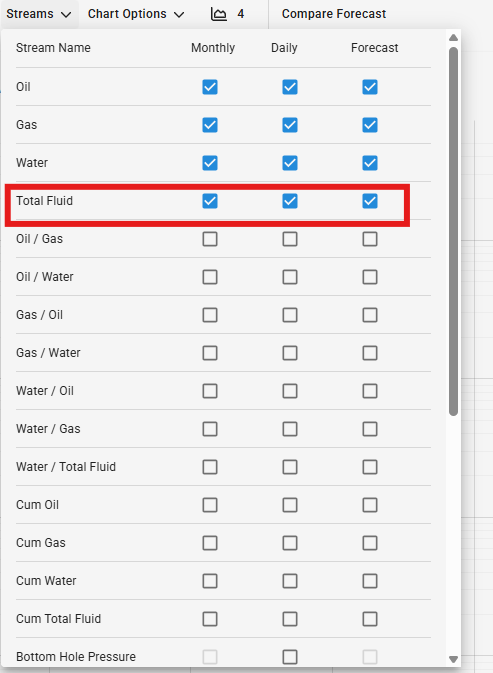
If you are not seeing Total Fluid as a stream option make sure to add the stream under Forecast Options > Stream Management and add the stream to charts by going to Streams > then check on the boxes.
In Modular Forecasting apply your DCA parameters to fit the historical rate-time trend and project the primary phase forward over your forecast period. You can add the forecast multiple ways: running Auto Forecast on just that phase, hold shift + lasso the production points to base the forecast on, or manually Add Segment.
Step 2 - Water Ratio Modeling
Navigate to the Water phase tab. Change the forecast type from rate-time to Ratio mode. This allows you to model water production as a ratio plotted against cumulative production. ComboCurve supports the following water ratio configurations -
Navigate to the Water phase tab. Change the forecast type from rate-time to Ratio mode. This allows you to model water production as a ratio plotted against cumulative production. ComboCurve supports the following water ratio configurations -
- WOR vs Oil CUM
- Water-Total Fluid Ratio vs Oil CUM
- WOR vs Total Fluid CUM
- Water-Total Fluid Ratio vs Total Fluid CUM
Tip: When choosing your ratio type - WOR (Water-Oil Ratio) is often preferred for high water cut wells, as it can better linearize on a semi-log scale. Water-Total Fluid Ratio is useful when total fluid rate is the primary driver.
To configure your your Water ratio forecast in ComboCurve by selecting your preferred ratio type from the drop down and then add a segment. There are the following segment options:
- Exp Incline
- Flat
- Linear
Step 3 - Gas Ratio Modeling (optional)
Navigate to the Gas phase tab and switch to Ratio mode. Gas forecasting follows the same workflow - on Gas phase, change to Ratio, choose Base Stream, choose x-axis, and Add Segment. ComboCurve supports two Gas ratio options:
Navigate to the Gas phase tab and switch to Ratio mode. Gas forecasting follows the same workflow - on Gas phase, change to Ratio, choose Base Stream, choose x-axis, and Add Segment. ComboCurve supports two Gas ratio options:
- GOR vs Oil Cum
- GOR vs Total Fluid CUM
Current Supported Permutations
Note: other may lead to unintended results
Total Fluid vs. Time:
1. WOR vs. Oil Cum - GOR vs. Oil Cum
2. WOR vs. Oil Cum - GOR vs. Total Fluid Cum
3. WOR vs. Total Fluid Cum - GOR vs. Oil Cum
4. WOR vs. Total Fluid Cum - GOR vs. Total Fluid Cum
5. Water Cut vs. Oil Cum - GOR vs. Oil Cum
6. Water Cut vs. Oil Cum - GOR vs. Total Fluid Cum
7. Water Cut vs, Total Fluid Cum - GOR vs. Oil Cum
8. Water Cut vs. Total Fluid Cum - GOR vs. Total Fluid Cum
Oil vs. Time:
1. WOR vs. Oil Cum - GOR vs. Oil Cum
2. WOR vs. Oil Cum - GOR vs. Total Fluid Cum
3. WOR vs. Total Fluid Cum - GOR vs. Oil Cum
4. WOR vs. Total Fluid Cum - GOR vs. Total Fluid Cum
5. Water Cut vs. Oil Cum - GOR vs. Oil Cum
6. Water Cut vs. Oil Cum - GOR vs. Total Fluid Cum
7. Water Cut vs. Total Fluid Cum - GOR vs. Oil Cum
8. Water Cut vs. Total Fluid Cum - GOR vs. Total Fluid Cum
See the Ratio vs Cum Calculations document for all calculation details.
Related Articles
ComboCurve: Ratio vs. Cum Calculations
ComboCurve: Forecast User Manual
Forecast User Manual Forecast Module How to create a new forecast Creating a forecast in ComboCurve will follow the same basic steps as creating any object within a module on the platform. This process will begin by either being on the project ...ComboCurve: Volumetric Forecasting
Volumetric Forecasting Overview Volumetric forecasting allows you to import externally generated forecast volumes directly into ComboCurve.. This article explains how to import a volumetric forecast, what the UI looks like once it is applied, what is ...ComboCurve: Import Forecast Parameter
Import Forecast Parameters In this article we outline the steps necessary to import a csv of forecast parameters into a ComboCurve forecast. ComboCurve uses a specific format for forecast csv import. To better understand this format, we recommend ...ComboCurve: Carbon Network Overview
Modeling Basics Carbon networks are composed of nodes and edges. Each node represents a point where a calculation occurs in the network, while edges indicate which nodes are related and what time series data is passed from node to node. Some nodes ...